I started collecting Mauchline’s daily rainfall data on the 7th January last year. These data presented below therefore don’t represent a full year’s rainfall but pretty close. I intend to carry on collecting rainfall for the foreseeable future as it allows us to look more closely at the influence of spates on run timings, particularly at obstacles where we can gather counter data and can examine fish run timing in relationship to spate conditions at obstacles. These data also allow us to understand some of the difficulties that farmers and landowners face as a result of weather throughout the seasons. While Mauchline may not be representative of the whole of Ayrshire, it is central and may give us a fairly reasonable indication of how the rest of Ayrshire fared with the weather.
Looking at Mauchline’s rainfall data over 2017, bear in mind that the January dataset is incomplete, missing the first 7 days of that month.
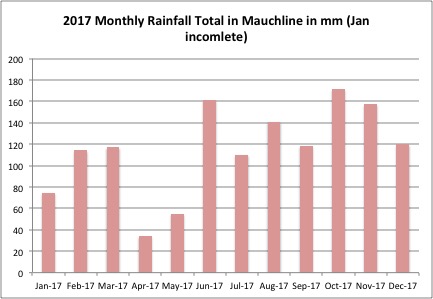
2017 Rainfall in Mauchline
Total rainfall in Mauchline during 2017 was recorded as 1375.6mm. The month with the most rainfall was October (171.5mm) followed by July (161.4mm) and November (157.5mm) The month with the highest mean daily rainfall averaged over the number of days that rain fell was October with 7.79mm of rain falling on wet days. When averaged over the entire month (including dry days), October mean average daily rainfall was 5.53mm. Comparing this to the dries month April, the mean daily rainfall averaged over the number of days Rainfall exceeded 20mm on 7 days in 2017. The wettest 3 consecutive days were on the 16,17,18th March with 71.2mm of rain falling. There were 17 consecutive dry days between the 25th April and the 11th May (during the smolt run). There were 110 days when rainfall was nil (or unrecordable) in other words 30% of the year was dry.
Looking more closely at dry days, we can see there are few consecutively dry days each month which has implications for land managers and farming practices (see the chart below). Where dry spells ran consecutively between months they have been included on the chart in orange and separately as monthly total days in blue.

Consecutive dry days. The two columns in orange represent consecutive dry days that overlapped more than 1 month. The was an annual total of 110 dry days

Comparing the dry days to overall monthly rainfall
January to May were below average rainfall (from a fellow rainfall collector nearby who has data going back 25 years). However, June onwards was extremely wet and above average. From other data, Gadgirth lower down the Ayr catchment, (5.9miles away) had a total of 1051mm against a 25 year average of 1091mm compared to Mauchline where we receive 20% more rainfall. The difference in altitude is interesting with Gadgirth around 35m as as compared to Mauchline at 130m ASL. That 95m makes all the difference. SEPA has a recording station at Blackdyke Farm to the east Mauchline in the lea of the hill. Blackdyke is 2.4 miles distant from my location but only 5m higher in altitude. at around 140m. I’ve noticed that I recorded slightly higher rainfall than they do normally, presumably an effect of being on the west of the hill between us (1198m). I may request their annual rainfall to compare 2017 results if it is freely available.
Many farmers were unable to get a harvest in this year and even more had difficulty spreading slurry in dry conditions. We have to be aware of these difficulties and the pressures on farmers and landowners that may not be immediately obvious. Similarly, the industry has to find solutions to these issues as we can only expect more extremes of weather in future as climate change takes hold. Global warming doesn’t mean we can expect drier summers in Ayrshire but in reality it means we should expect wetter and more extreme weather conditions all year round. There are no easy solutions to these problems.